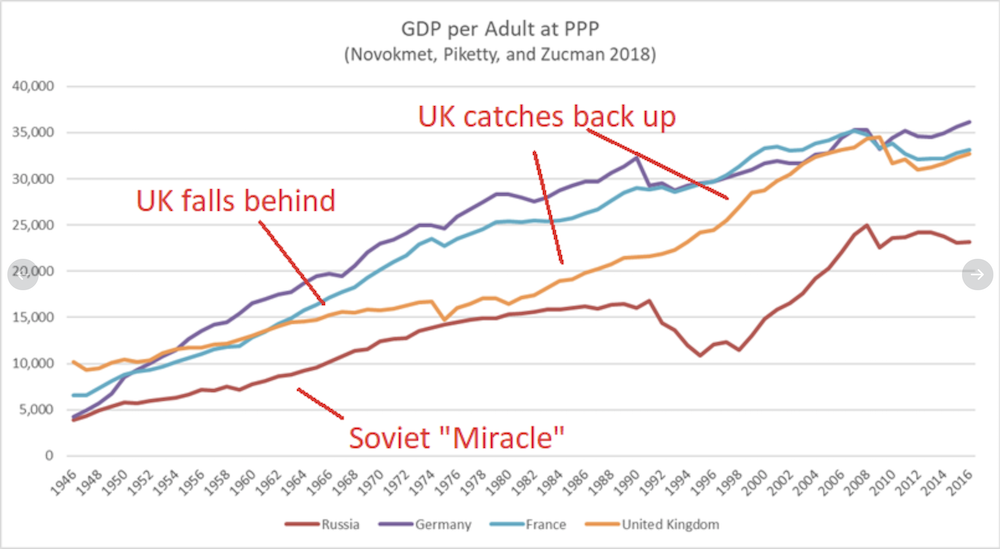
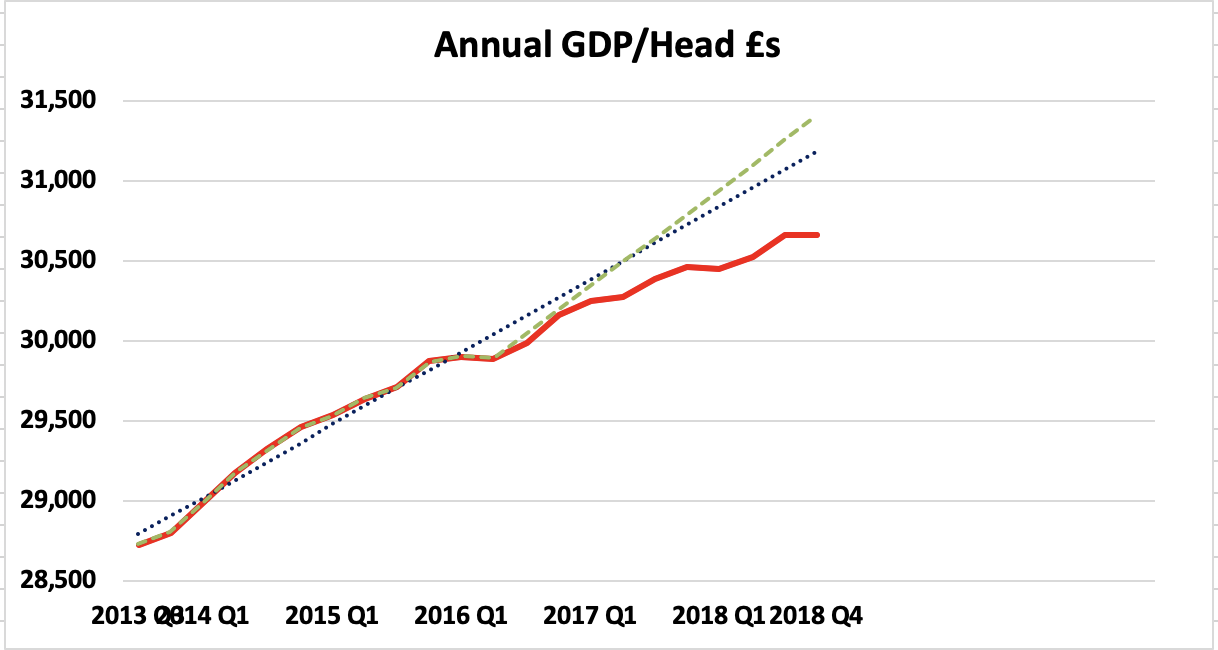
These five charts summarise economic and other developments since the Brexit referendum in June 2016.
This first chart compares actual GDP per person (the red line) with two (green and blue) pre-referendum trend lines. The gap is now around 1.7% to 2.4% - that is £500-700 per person pa. For more detail, see the notes at the end of this web page.
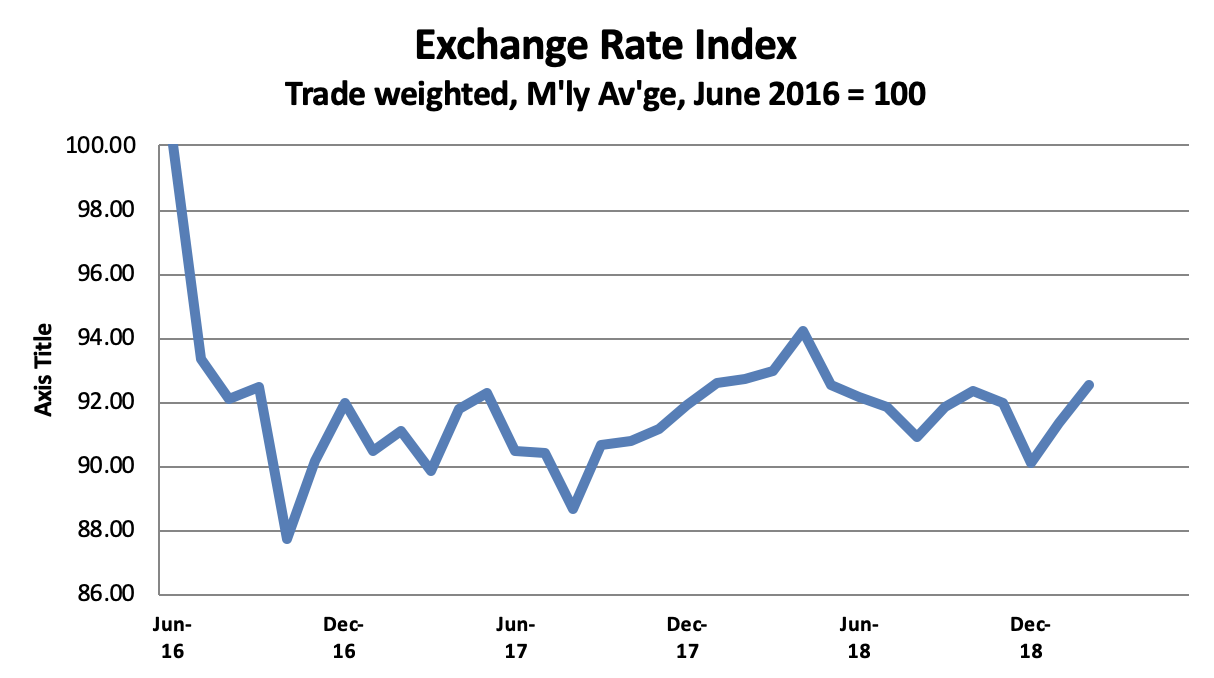
This next chart summarises currency traders' valuation of the £ Sterling.
Sterling fell by around 12% over the weeks following the referendum and then recovered slightly. It was around 7% down last month.
Note: Most commentators focus on the £/$ and/or £/€ rate whose change can be seen in real time. This Exchange Rate Index is however much better as it melds together all the UK's exchange rates in proportion to our trade flows around the world. It is therefore the composite rate seen by all our exports and importers.
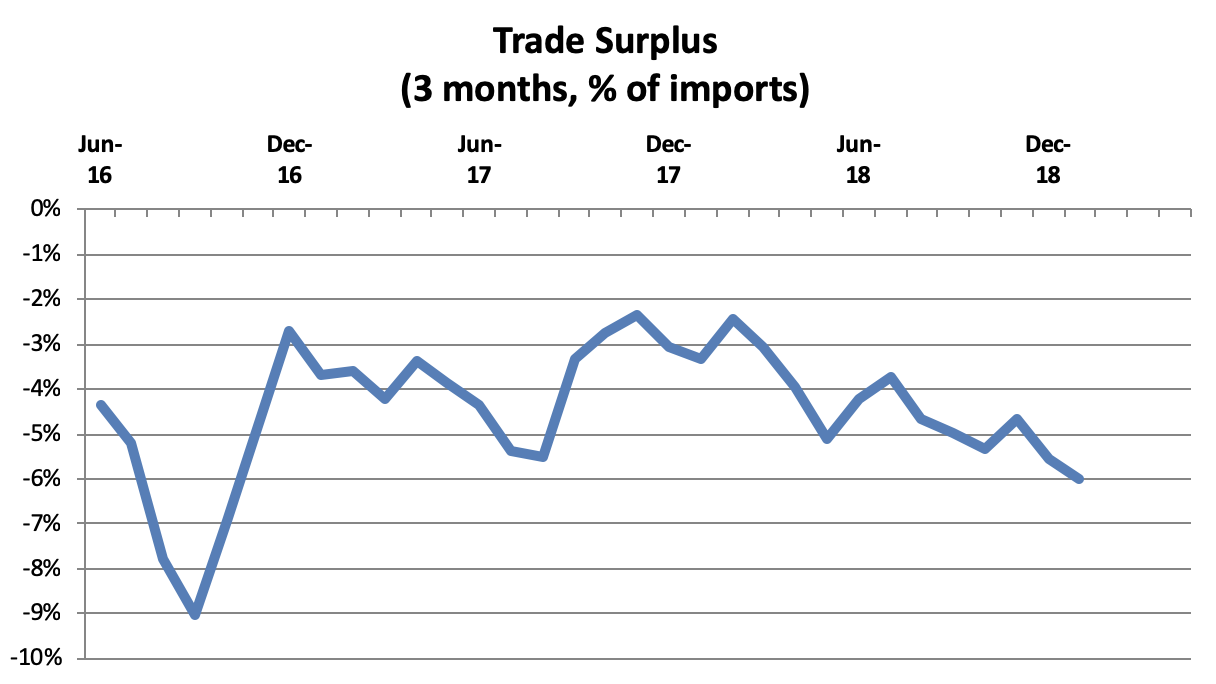
When measured in £ Sterling, the immediate effect was to increase the cost of imports by 12% thus increasing the trade deficit to 9% of imports. Over time, however, the UK should have begun to export more (as our products appeared to cost less to overseas buyers) and import less. This correction happened quite quickly but a significant trade deficit nevertheless persists and appears to be growing. This is, I understand, by far the worst response to any major sterling devaluation since World War 2.
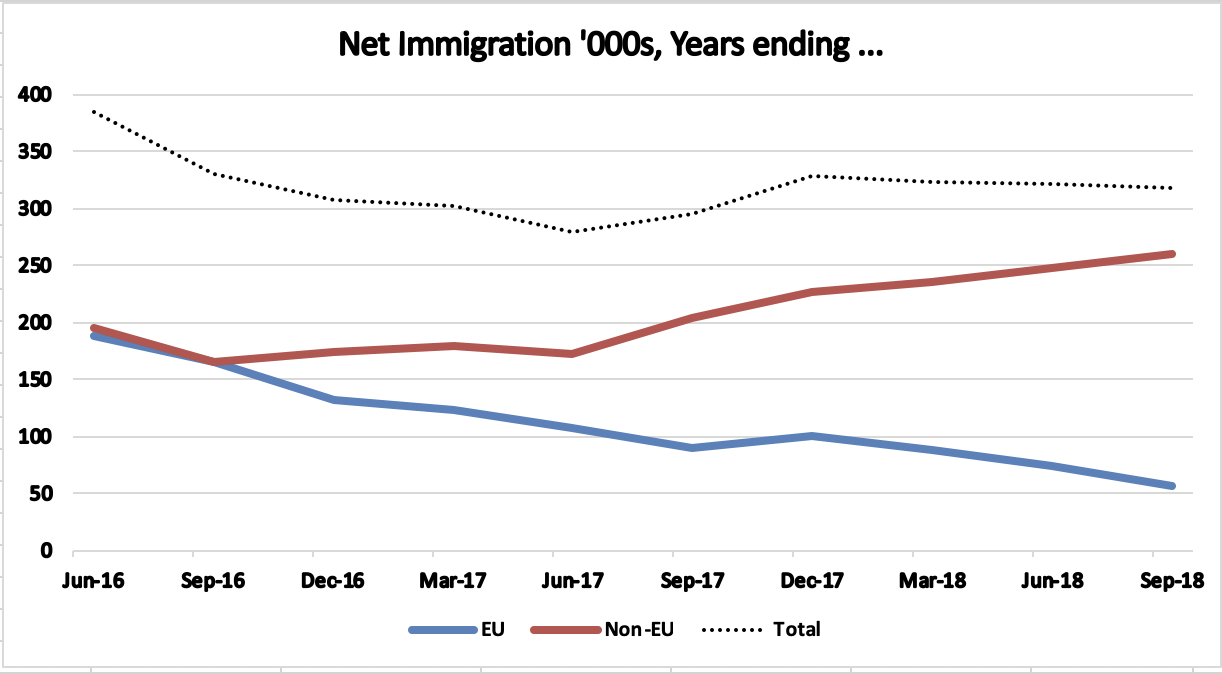
Unsurprisingly, net immigration from the rest of the EU has steadily fallen since the referendum - partially balanced by an increase in net immigration from the rest of the world.
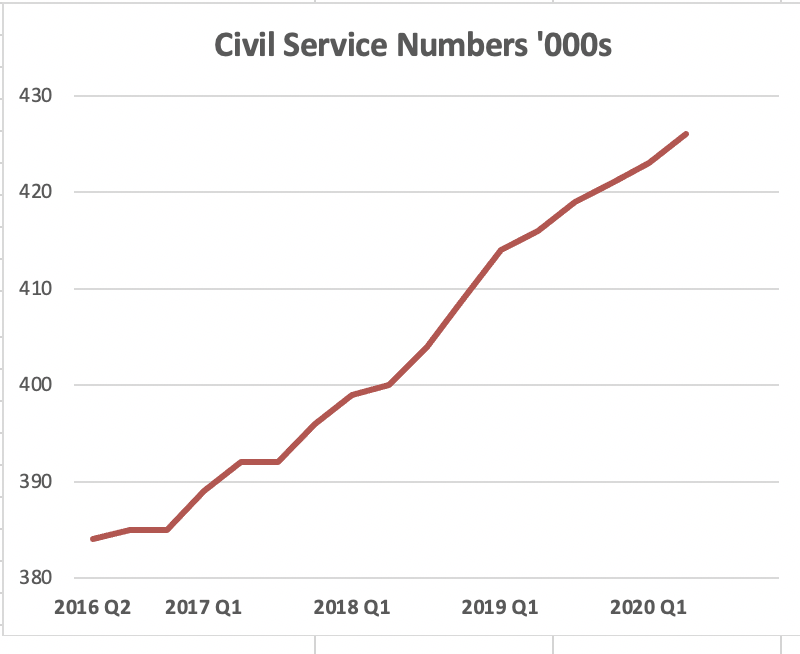
And, finally, there has been a steady increase, now totalling around 25,000, in the size of the civil service, sharply reversing the previous trend.
Note: The numbers are 'full time equivalent'; in other words, those working half time count as 0.5.
Notes:-
GDP/Head
GDP/head is a much better indicator than GDP itself as the latter is strongly influenced by population growth, including from immigration. Indeed, immigration has probably added around 16% to UK GDP since the late 1980s - around 0.5%pa.
The effect of increases in GDP/head on wages depends on how changes in national income are distributed over time, This in turn depend on tax rates, benefit levels, and other policy decisions. If wages fall faster than GDP/head, it means that others - such as investors - are doing relatively better. And vice versa, of course.
Post-Referendum Uncertainty
As Brexit has not yet happened, the principal pre-Brexit effect arises from the increased uncertainty and nervousness felt by both businesses and consumers.
Researchers have estimated what would have happened for the UK - if there had been no vote to leave the EU - by studying what has happened to other similar economies that did not vote to leave. Academics from Bonn, Oxford and Tübingen have used this approach to analyse how the Leave vote has affected UK output, as measured by Gross Domestic Product (GDP). They estimate what would have happened using a control group of countries whose average GDP growth exactly matches UK growth prior to the referendum. Their hypothesis is that, but for the Leave vote, growth in the UK and the control group would have continued to match after June 2016. By the middle of 21018, they estimate that UK GDP was approximately 2% (£350m a week) lower than it would have been if the UK had voted remain.
The UK had under-performed the Spring 2016 IMF forecast by 2.2% by the end of 2019. No other large economy under-performed their IMF forecast.
Separately, as of September 2018, economists at UBS Group estimated that UK GDP was already 2.1 percent smaller than it would have been if the Brexit vote had gone the other way. This is consistent with the difference between actual GDP/Hd and the green trend line in the first chart, above, which assumes that GDP/Hd might otherwise have increased by 2% pa from June 2016.
The slightly more pessimistic blue line in the above chart assumes a continuance of the weaker GDP performance from 2013-16. Either way, actual post-referendum performance has been noticeably poor.
A September 2018 Resolution Foundation blog provides an excellent overview of the performance of the UK economy since the 2018 financial crisis.
Brexit Impact Forecasts
Once Brexit happens, there should be an immediate post-Brexit bonus as a result of the reduction in uncertainty. In the longer term, however, there could be increased trade friction, reduced foreign direct investment, and lower net immigration.
The Treasury have issued two long term forecasts.
- The first, in April 2016, suggested that Brexit might reduce GDP/head over 15 years by between
- £1100 pa if the UK were to remain in the EEA
- and £2100 pa if there were no negotiated settlement.
- The second, in late 2018, suggested that the same factors might reduce GDP in the long term by 4.9 to 5.4% if the UK leaves on terms similar to those in the then draft Withdrawal Agreement.
The NIESR, in December 2018, thought that the long term reduction might be 3% per head - i.e. c. £900 pa at 2018 prices.
The FT reported as follows in March 2019
A few days before the vote, three of the UK’s most reputable economic institutions — the National Institute of Economic and Social Research, the Institute for Fiscal Studies and the Centre for Economic Performance at the London School of Economics wrote a short joint statement under the heading: “Leaving the EU would almost certainly damage our economic prospects”. In it, they predicted the economy would be between 1 per cent and 3 per cent smaller by 2020 than if the UK stayed in the bloc. Further hits would come thereafter, they said, with the severity depending on the type of Brexit chosen. The pound would fall, real wages would be lower, public borrowing would therefore be higher and unemployment would rise.
Apart from predicting an unemployment rise — its absence is part of a longer UK puzzle of disappointing productivity growth amid strong employment gains — the outlook was remarkably accurate. The economy is now 1.5 per cent smaller than the Bank of England forecast in May 2016 while the world economy has been stronger than expected. Compared with similar advanced economies, studies estimate the UK Brexit hit to be 2.3 per cent.
After the referendum, mainstream forecasters were even more accurate. The Office for Budget Responsibility got the size of the economy at the end of 2018 almost spot on. Its error was within 0.1 per cent. In contrast, the pro-Brexit lobby group, Economists for Free Trade, was far too optimistic and George Osborne’s Treasury short-term shock scenario was much too pessimistic. They made opposite errors some 25 times larger than the OBR.
Economic Performance during EU Membership