This page was last updated in June 2026. Please follow @ukcivilservant.bsky.social on Bluesky for notifications of new and amended material.
Key Facts
The UK workforce currently totals around 34.4 million, of which …
… around 18.0% (6.2 million) work in the public sector, and of which …
… only around 1.6% (558 thousand - around 9% of public servants) are in the civil service.
The number employed by the civil service is now 36% higher than its minimum in 2016, and only 2% less than its most recent peak in 2005.
The following two charts summarise the above data.
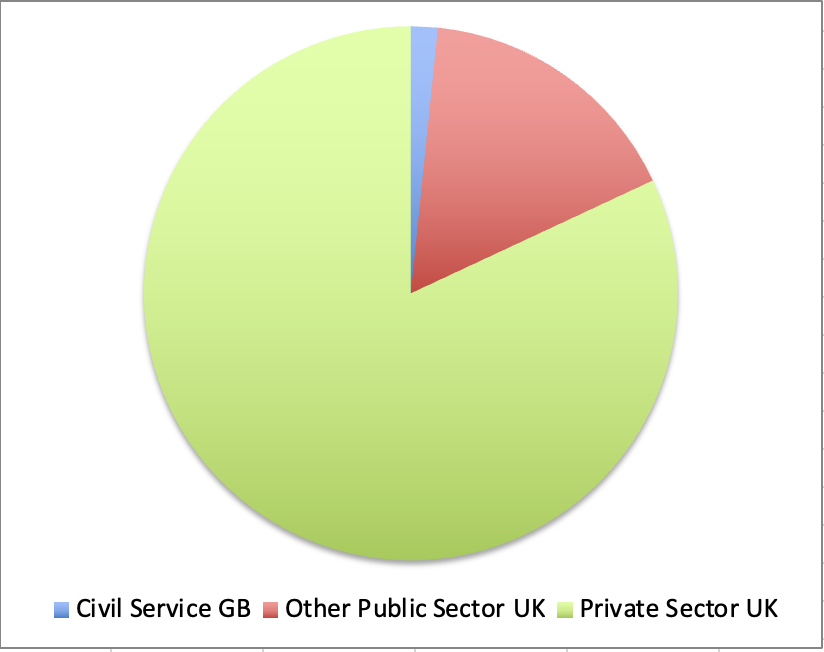
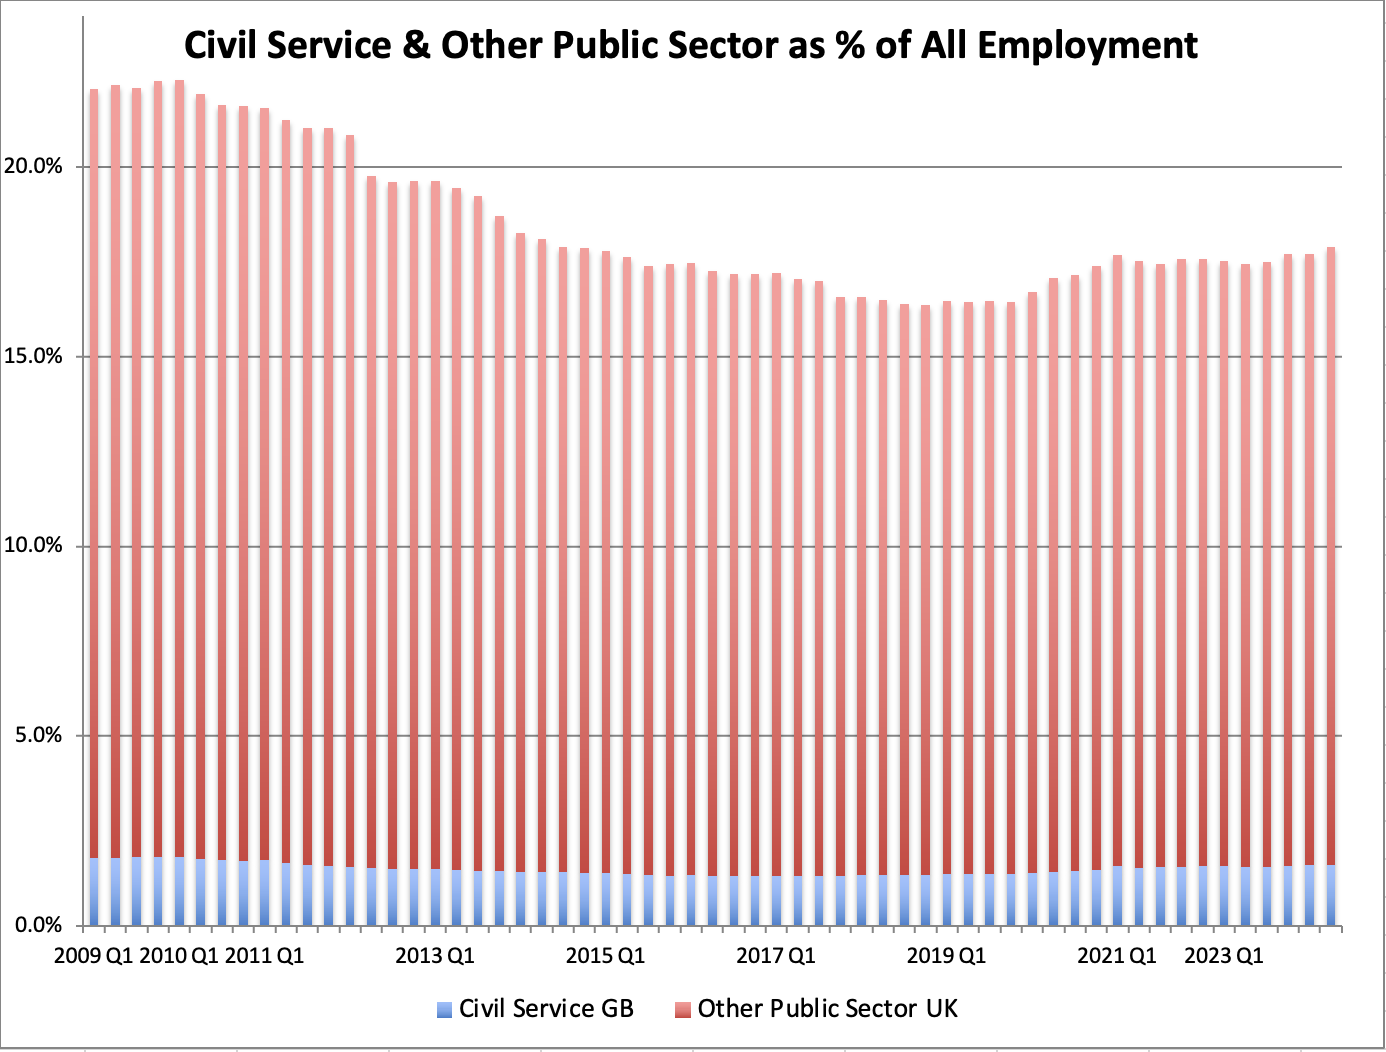
Note: The figures in the first para above, and the above charts, are 'headcount', i.e. part-timers count as 1 each. (This is because full time equivalent figures are not available for the private sector.)
The next charts track various measures of the number of full time equivalent (fte) civil servants. There were around 524,000 fte civil servants in post in March 2026, including casual/temporary staff but excluding security personnel (see Note 3 below).
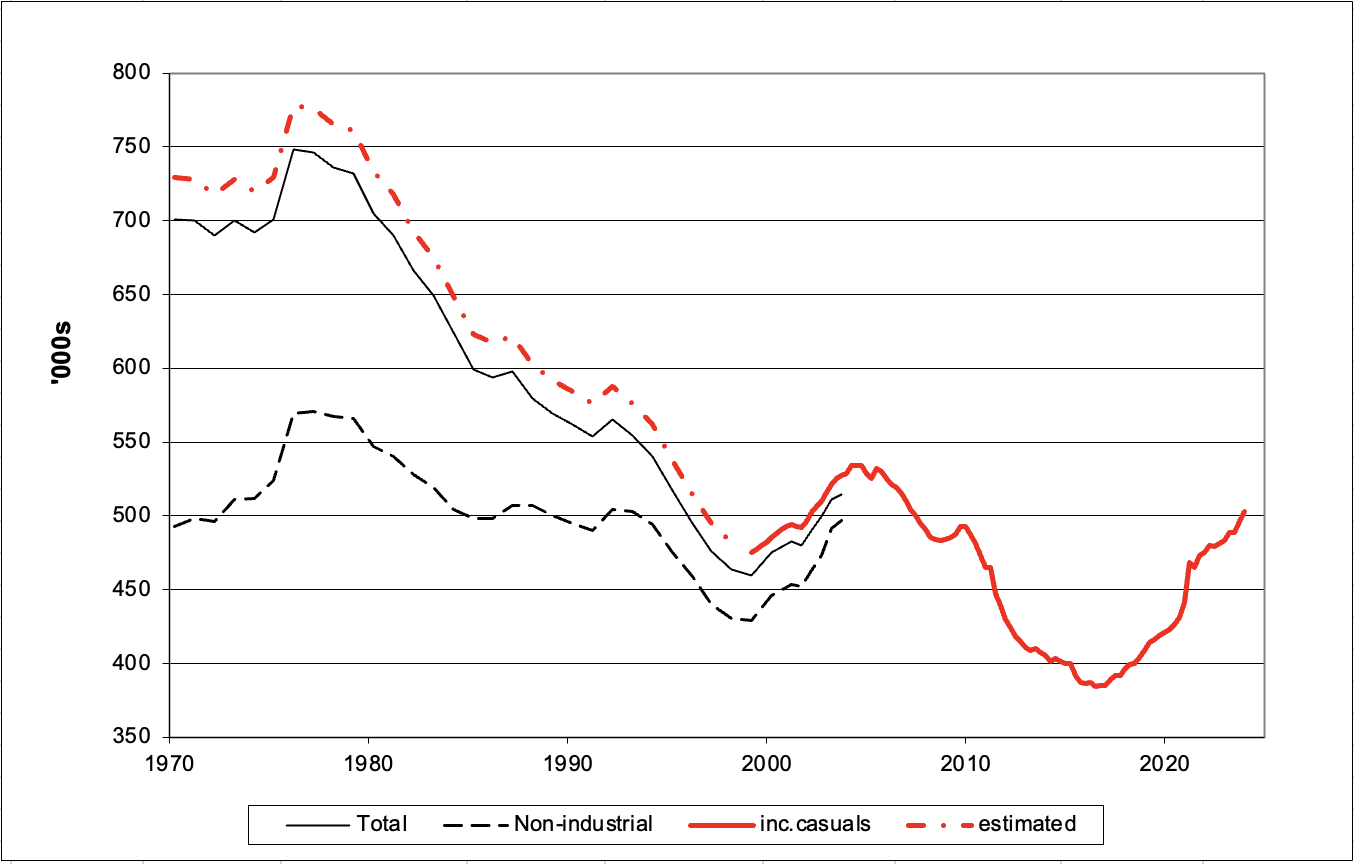
Notes:
- ‘fte’ means that half-timers, for instance, are counted as 0.5. Total headcount (where every part-timer counts as 1.0) is significantly higher (c.34,000 higher as at March 2026).
- Until 2003, the Cabinet Office published regular statistics excluding casual staff (c.11,000 in 2004) and separating out “non-industrials” (i.e. office staff) from “industrials” (i.e. blue collar workers, postal workers). These are the two thin black lines in the above chart. They include security personnel.
- The Office of National Statistics then became the main provider of reliable statistics. Their figures, which are seasonally adjusted and include both “industrials” and casual staff, and are shown in the thick red continuous line in the above chart. The thin dotted red line provides a rough estimate of what total numbers might have been previously, including casual staff.
Civil Service Numbers: Historical Summary
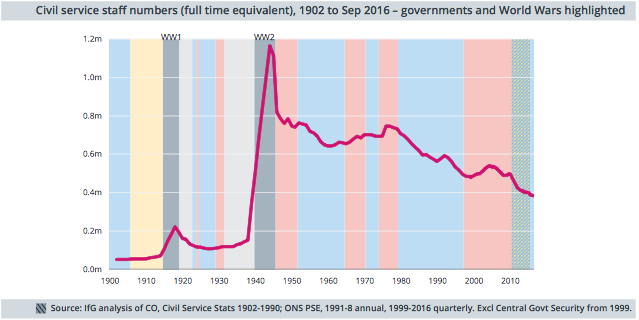
The 1854 Northcote Trevelyan Report put the number of civil servants at not less than 16,000. By 1902, there were around 50,000 non-industrial civil servants but the Tomlin Royal Commission 1929-1931 reported that there then 302,000 non-industrial and 122,000 industrial civil servants. By 1939, these numbers were 163,000 and 184,000 respectively. Many non-industrials were engaged in supporting the armed services (for instance in the Royal Naval dockyards) or in organisations such as the Royal Mail. By 1944, towards the end of the war, the totals had reached 505,000 and 658,000 respectively, a grand total of 1,164,000 civil servants.
The number of blue collar (industrial) civil servants then began to fall, aided by privatisation, reclassification and contracting out, so that there were only 18,200 in post as at October 2003.
Post 1979 Conservative Government: The number of white collar (non-industrial) civil servants has not fallen in anything like the same way. Indeed, it hit a maximum of 571,000 (excluding casuals) in 1977, before Mrs Thatcher's government was elected in 1979. It then fell to a low of 475,000 (now including casuals) in Q1 1999, about 18 months after the election of Tony Blair's New Labour government.
The dramatic cut in civil service numbers during the 1980s was made easier for those concerned by the huge retirement bulge deriving from the large scale recruitment of civil servants during the war and the Attlee government. By contrast, it is the smaller cohort recruited during that period, when civil servant numbers fell by a third, who are retiring now, which makes downsizing rather more difficult.
New Labour Government to 2010: CS numbers then started to rise again, plateauing at around 534,000 in 2004 before Chancellor of the Exchequer Gordon Brown announced in July 2004 that he intended to cut c.84,000 posts, whilst creating a number of new posts in the front line so that the net reduction would be c.70,000. Civil service numbers were subsequently increased by the transfer of 11,000 fte magistrates court staff from local authority control to the new central government courts service. The then Chancellor’s (and in due course Prime Minister’s) target therefore became around 475,000. In the event, the target was nearly reached as numbers had fallen to 484,000 before the deadline of the end of 2008, and there were only around 481,000 fte civil servants by the time of the 2010 General Election.
It is interesting to note that these reductions were not always mirrored by changes in the number of Senior Civil Servants (SCS). Click here for further detail.
Coalition Government 2010-2015: The incoming 2010 coalition government said that it aimed to achieve a one-third reduction in central government administration costs, which probably translated into reductions in fte civil service numbers from around 481,000 in Q2 2010 to a target of around 375,000 by Q2 2015. The number in fact stood at 392,000 in Q2 2015.
Conservative Governments 2015-2024
The Chancellor's 2015 Autumn Statement foreshadowed further significant but unquantified reductions in the sizes of the main Whitehall departments. The fte total had fallen to 384,000 by June 2016 but then began to rise quite quickly, reaching 475,000 by December 2021, mainly reflecting recruitment following the June 2016 Brexit referendum. Part of the further increase from mid-2020 will have been attributable to needing more staff devoted to Covid related work such as paying benefits. There was a small drop in Q2 2021 caused by temporary census staff no longer appearing in the statistics. The upward trend continued in Q3 2021.
Brexit seems to have required the recruitment of many 10s of thousands of officials - maybe more than the c.60,000 employed by 'Brussels' to carry out all centralised EU functions. Assuming a cost/head of £45k to include salaries, accommodation, employers' pension contributions & NIC, etc., Brexit might have cost £3 billion pa in staff costs alone.
(The 2024 Conservative Party manifesto assumed a cost of £45k per head when calculating the savings that might be achieved by reducing the number of civil servants.)
Chancellor Rishi Sunak announced in his 2021 Budget that the government planned to reduce "non-frontline" civil service headcount to 2019-20 (that is pre-pandemic) levels as part of plans to reinvest 5% of departmental budgets into “priority areas” by 2024-25, As so often with that government, there was little indication that the detail had been thought through, including the definitions of 'frontline' and 'non-frontline'. But ministers let it be known that they expected civil service headcount to fall by 25,000 so that the fte total would fall from 473,000 in 2021 Q3 to 448,000.
In an interview with The Times in early 2022, Jacob Rees-Mogg, the new Minister for Brexit Opportunities and Government Reform, said that 'at least 65,000 posts must be cut' to bring the civil service 'below 425,000' so as to ensure that Brexit had led to a significant reduction of jobs. According to The Times, he also said that "he would personally review every new vacant post to see if it could be closed down". His ministerial colleague Steve Barclay told MPs that “This is also about empowering civil servants and taking away often the many layers so that the very good work of sometimes more junior civil servants can get to ministers and senior decision makers”.
Then, in May 2022, the Government announced that it intended to reduce the civil service to its pre-Brexit referendum size of 384k fte by mid 2025 - despite the fact that Brexit had repatriated a significant number of regulatory etc. responsibilities from 'Brussels', and required additional border control staff. The resultant number would be 91k lower than the (then latest reported) 2021 Q4 figure of 475k.
Comment:- Asked on the Today programme what the government wanted to do less of, Jacob Rees-Mogg said: “We are actually going back to the level that we had at 2016. So it’s not a question of doing less of, it’s doing things more efficiently.” Cabinet Secretary Simon Case took a very different line in front of a Parliamentary committee, identifying three types of saving. There would be a contribution from efficiency, but this had its limits, especially as he ruled out significant reductions in quality of service. There would also be a contribution from transformation. (Commentators noted that such savings were somewhat speculative and (once identified) would be slow to materialise. ) Much therefore would depend on Minister-chosen prioritisation.
The size of the civil service had in fact increased by a further 5,000 by March 2022, so increasing the 2025 target job losses to 96,000. To no-one's surprise, the Government announced later in 2022 that it had abandoned its target of cutting 91,000 civil service jobs. Cabinet Office minister Alex Burghart told MPs in early 2023 that the Government was now unlikely to give a headline figure for the number of civil service jobs it would like to cut. “I don’t want to give you the impression that we’re not seeking to make savings. We very much are. It’s just that ... previous ministers have set a numerical target and – you know – we’re not doing that. Government absolutely always is looking for efficiencies. Those efficiencies come in a plethora of different ways.”
Chancellor Jeremy Hunt nevertheless announced at the Conservative Party Conference in October 2023 that civil service “expansion” would be “frozen” and a plan would be put in place to return it to its pre-Covid size - i.e. 423,000. No-one appears to have taken this announcement very seriously as the target was announced in advance of there being any plan to achieve it, and it did not seem likely that the Conservatives would be around to oversee any plan that emerged.
And civil service numbers did indeed continue to increase - and had reached 515,000 by September 2024. Much of this further expansion was driven by pressure on frontline services. An increase in the size of the operational delivery profession - roles such as prison officers and immigration caseworkers - played a significant part in driving this increase.
Labour Government July 2024-
Departments were told in late 2024 that they needed to cut costs so as to release money for investment. Ministers let it be known that they expected that this would led to a reduction of around 10,000 in the fte headcount - that is around 2%.
Chancellor of the Exchequer Rachel Reeves then announced in March 2025 that she intended to cut the government's administrative (running) costs by 15% by the end of the current Parliament. This implied a larger reduction, probably around 40,000, reducing the fte total to around 475,000. But the total in fact rose to 524,000 by March 2026 - an increase of 8,000 over 12 months.
Notes
1. Changes in civil service numbers do not necessarily translate into parallel increases/decreases in public expenditure, nor in the size of the state. This is because reductions in the size of the civil service can be the result of out-sourcing to the private sector, whilst reductions in the number of quangos etc. can lead to their functions, and their staff, ending up in central government, and so increasing civil service numbers. Other staff have occasionally been transferred to local authorities.
A significant reduction in numbers between Q1 and Q2 2015, for instance, was assisted by the transfer of c.7,000 staff to the private sector or to newly-created government-owned companies such the Highways England and the Ordnance Survey.
A previous increase in numbers occurred in 2014 when the Probation Service was subsumed within the National Offender Management Service within the Ministry of Justice.
2. Reclassifications of the status of employers can also make significant differences to the statistics. Here are the main changes to the definition of public sector in recent years, though none affected the definition and size of the civil service:
- Sept 2008: Housing Associations in England reclassified from private to public sector
- Dec 2008: Lloyds Banking Group and Royal Bank of Scotland moved from private to public sector
- June 2012: English colleges moved to the private sector
- Dec 2013: Royal Mail plc moved to the private sector
- Mar 2014: Lloyds Banking Group moved back to the private sector
3. Outsourcing and its reversal affects the number of civil servants but can increase (or decrease) total government expenditure. The partial reversal of IT outsourcing in the 2010s/20s has probably increased headcount, for instance, but saved money and improved results.
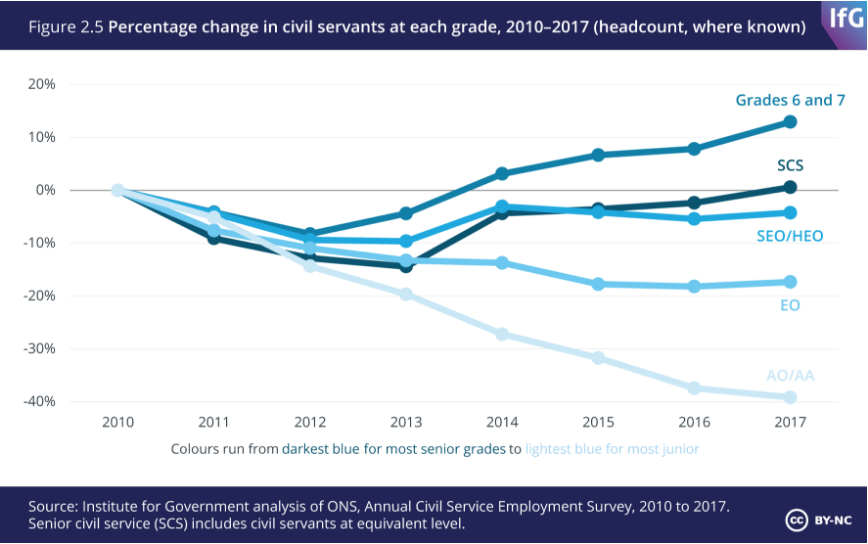
4. The IfG published this interesting chart in 2018. The post-2010 reduction in civil service numbers was clearly proportionately greater at the lower end of the pay range.
5. For operational security reasons, Central Government Security Workforce numbers were omitted from civil service statistics published after the summer of 2016, and there were consequential revisions to public and private sector employment estimates back to March 1999. These revisions have been carried through into the above text and charts (with the exception of the two black lines in the third chart).
6. Other Civil Service statistics may be found here.
7. Michael Coolican wrote an excellent history of the civil service from the Normans through to 2018, including quite a bit about civil service numbers. His book is called No Tradesmen and No Women.